

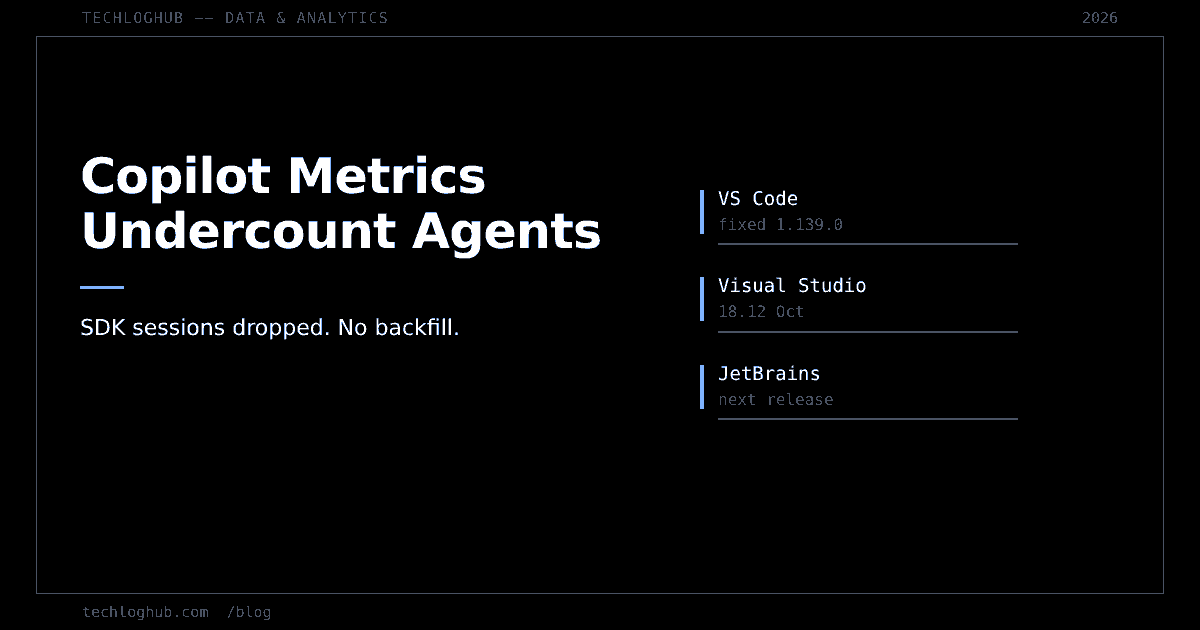
Copilot Usage Metrics Undercounted Your Agents
Quick answer: Several IDEs moved Copilot agent sessions onto the Copilot SDK without identifying the source IDE, so GitHub's usage metrics dropped most of that activity and attributed some of it to Copilot CLI. GitHub confirmed this on 6 October 2026. Billing is unaffected, but the agent numbers in your enterprise, org and user reports are wrong, and GitHub says past data cannot be backfilled.
If you have been using GitHub's Copilot usage metrics to decide whether agent mode is earning its seat cost, stop and re-read the baseline. On 6 October 2026 GitHub published a changelog entry explaining that agent activity has been going missing from those reports — not a rounding gap, but whole categories of activity dropped or filed under the wrong client.
The cause is mundane and instructive. Several IDEs moved their Copilot agent sessions to the Copilot SDK. Those sessions did not identify their source IDE. Metrics attribution keys on the source IDE. So most of that activity was dropped from reports, and some of it was counted as Copilot CLI activity instead.
Which numbers are wrong
GitHub is specific about the damage, which is more than most vendors manage when they break their own telemetry:
Agent activity is undercounted for developers on affected IDE versions. That covers agent interactions and agent lines of code — specifically loc_added_sum and loc_deleted_sum for agent_edit — across enterprise, organisation and user reports, in both the 1-day and 28-day views.
Copilot CLI metrics are inflated, because some of the unattributed SDK traffic landed there. GitHub says this will stop as clients update, but that past CLI figures cannot be corrected either. CLI users themselves need to take no action.
Billing is not affected. Only attribution in usage metrics changed. That distinction matters for how alarmed to be: you were not overcharged, you were mis-measured. For anyone who has been building an internal adoption dashboard off this data, the second problem is the expensive one.
The fix is a client update, and it is staggered
GitHub is rolling a fix out per IDE. Only versions that use the Copilot SDK for agent mode are affected; developers on earlier versions were being counted correctly all along, which is an unusual shape for a bug — updating made your data worse.
| IDE | Fixed version | Availability |
|---|---|---|
| Visual Studio Code | 1.139.0 and later | Available now |
| Visual Studio | 18.12 | Expected October 2026 |
| JetBrains IDEs | Next plugin release | Expected by late October 2026 |
| Eclipse | Next plugin release | Expected by November 2026 |
| Xcode | Next plugin release | Expected by November 2026 |
Three of those five are "next plugin release" with a month-shaped estimate rather than a version number. If your organisation is a JetBrains or Xcode shop, your agent metrics stay unreliable into November, and every day of that window is a day of data you will never get back.
No backfill is the part to plan around
GitHub states that past data cannot be backfilled, and that recovery will be gradual as developers update rather than a single jump. Both halves of that sentence have consequences.
No backfill means any chart with agent adoption on the y-axis and September or early October on the x-axis is permanently wrong. You cannot fix it; you can only annotate it. Do that now, in the dashboard, with the changelog URL in the annotation — otherwise someone will read a flat line in a quarterly review next year and conclude that agent mode failed.
Gradual recovery is the subtler trap. As developers update, agent counts will climb for reasons that have nothing to do with behaviour. Anyone who measures adoption as a week-over-week delta is about to see a growth curve that is pure instrumentation. If you report on this to a board or a budget holder, say so before the number does.
This is the structural weakness of client-side telemetry
GitHub's own guidance in the entry is the honest version of the problem: gaps between client-side reports and other Copilot data usually come from the client side. The recommended hygiene is to keep IDEs and Copilot extensions current and enforce minimum versions where possible, keep IDE telemetry enabled, allow the Copilot telemetry endpoint through proxies and firewalls, and check last_known_ide_version and last_known_plugin_version in per-user totals_by_ide data to find outdated clients.
Unpack what that means. A metric that depends on every editor on every laptop reporting its own identity through a network path your security team also controls is a metric with four independent failure modes before it reaches a dashboard. Any one of them produces a number that looks plausible, which is the worst property a number can have.
We have written the same post about a different vendor product this year. Google's generative AI report in Search Console ships with no Queries dimension at all, so you can see that AI surfaces sent traffic without ever learning what for. GitHub's Actions API changed what it counts mid-flight too. The pattern across all three: vendor dashboards are instrumentation of the vendor's product, not of your engineering organisation, and they change without regard for your time series.
What to do, in order
First, pull totals_by_ide and read the version columns. That tells you which part of your fleet is producing bad data right now and how much of your population it represents. If you work with the raw API payloads, our JSON formatter and JSON to TypeScript tools make that a two-minute job rather than a scrolling exercise.
Second, get VS Code to 1.139.0 or later, since that fix is already shipped, and set a minimum-version policy if you manage IDE versions centrally. GitHub's advice is to move developers directly to the fixed versions.
Third, annotate the affected period in whatever dashboard consumes this data, and stop quoting agent lines-of-code figures from it until your fleet has converged. Fourth, if agent adoption is load-bearing for a budget decision, add a measurement you own — merged PR counts, review latency, your own commit metadata — so that the next vendor instrumentation change costs you a footnote instead of a quarter. Tooling for that lives in the data and analytics and developer tools categories.
Credit where it is due: GitHub named the affected fields, published the fixed versions, and said out loud that the data is gone. That is better disclosure than most telemetry bugs get. It is still a reminder that a dashboard you do not own is a dashboard you cannot audit.
FAQ
Was I overbilled because of the Copilot metrics bug?
No. GitHub states that billing is not affected and that only attribution in usage metrics changed. The problem is measurement, not charges.
Which Copilot metrics fields are affected?
Agent interactions and agent lines of code, named in the changelog as loc_added_sum and loc_deleted_sum for agent_edit. The undercount applies to enterprise, organisation and user reports, in both the 1-day and 28-day views. Copilot CLI figures were inflated in the same period by unattributed SDK activity.
Will GitHub backfill the missing agent activity?
No. GitHub says past data cannot be backfilled and that recovery will be gradual as developers update, not a single jump. Activity from affected versions cannot be recovered later, so annotate the affected period rather than waiting for the numbers to repair themselves.
How do I tell which developers are still on an affected version?
Check last_known_ide_version and last_known_plugin_version in the per-user totals_by_ide data, which GitHub recommends for finding outdated clients. Visual Studio Code is fixed in 1.139.0 and later; Visual Studio in 18.12, expected October 2026; JetBrains, Eclipse and Xcode in their next plugin releases, expected late October to November 2026.
Why did older IDE versions report correctly?
Only IDE versions that use the Copilot SDK for agent mode are affected, because those sessions did not identify their source IDE. Developers on earlier versions were still counted correctly, which means in this case updating an editor is what broke the reporting.
Does blocking telemetry at the firewall affect these reports?
Yes. GitHub's guidance is to keep IDE telemetry enabled and to allow the Copilot telemetry endpoint through proxies and firewalls, and it notes that gaps between client-side reports and other Copilot data usually originate on the client side. A proxy rule can silently remove a team from your adoption numbers.
Compare analytics and developer tooling in the TechLogHub product directory, or read how we think about comparing developer tools.