CodeBurn
CodeBurn: A Local-First Dashboard for AI Coding Costs
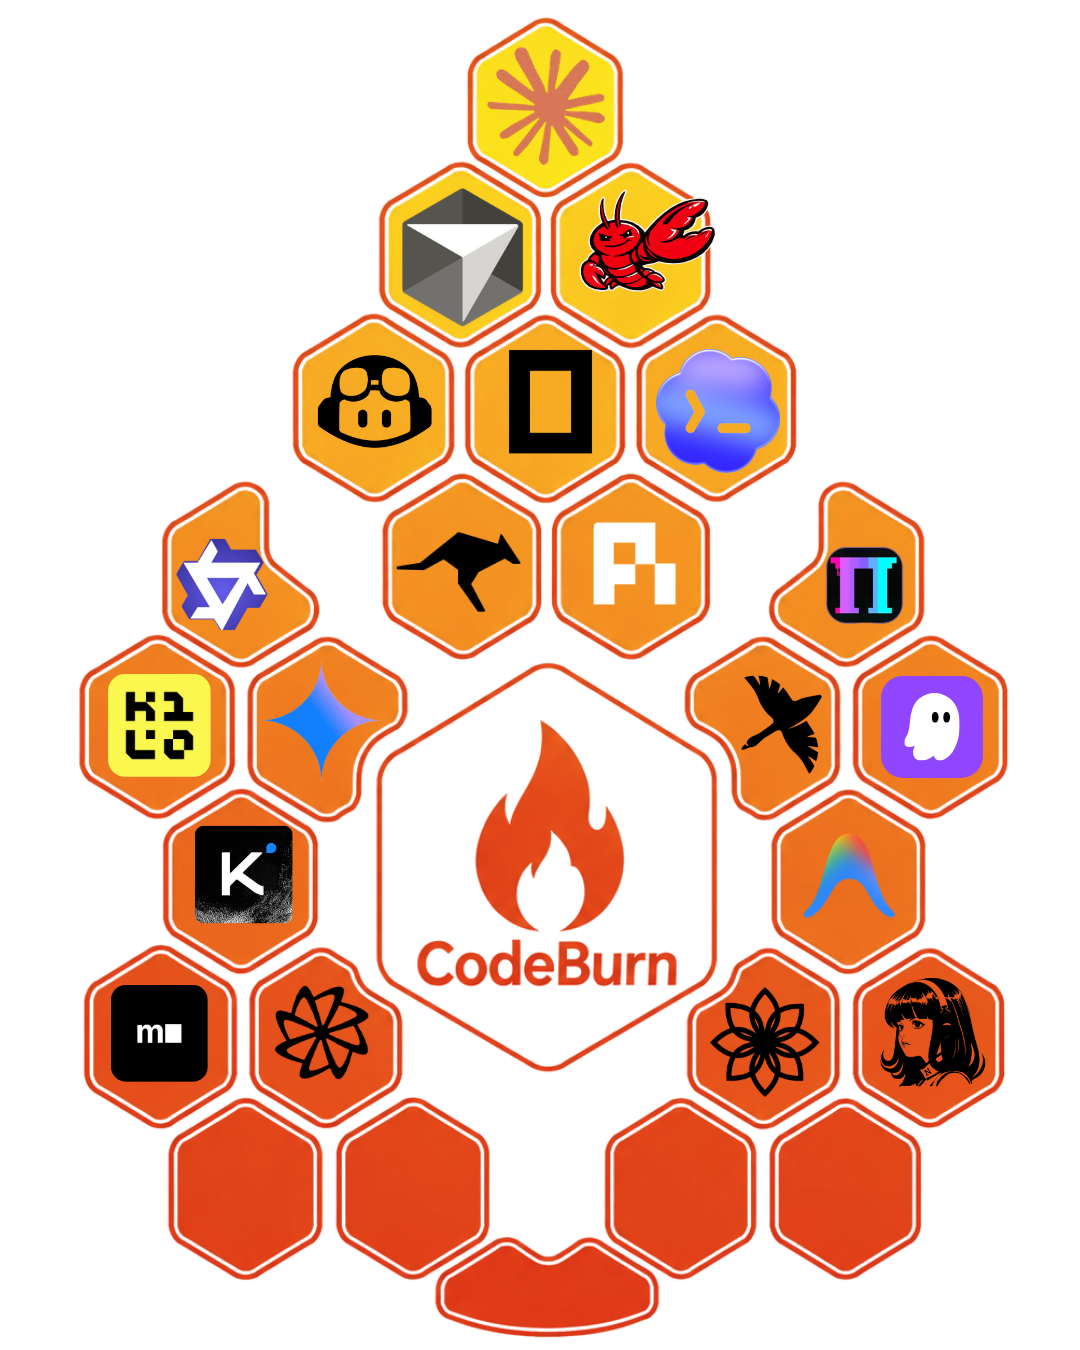
Introduction In a world where AI copilots and code assistants are everywhere, keeping track of token usage, costs, and performance can feel overwhelming. CodeBurn arrives as a local-first solution that shines by taking the guesswork out of spending. It monitors token usage, cost, and performance across 25 AI coding tools, breaking down every dollar and every token by task, model, tool, project, and provider. The best part? It runs entirely on your machine. No wrappers, no proxies, and no API keys needed. CodeBurn reads session data directly from disk and prices each call using LiteLLM, a pricing engine designed to be accurate, fast, and locally cached.
What you get with CodeBurn
- Full visibility into where your AI coding budget goes
- Breakdown by task type: coding, debugging, feature development, refactoring, testing, exploration, planning, delegation, Git ops, build/deploy, brainstorming, and more
- Per-model and per-provider cost analysis, including Opus, Sonnet, Haiku, GPT-5, GPT-4o, Gemini, Kiro, and many others
- Per-project and per-task breakdowns alongside model-specific token usage
- Local operation: reads session data on disk, pricing data cached on your machine, no data ever leaves your device
- A polished UI that blends a terminal-based dashboard with quick-access controls
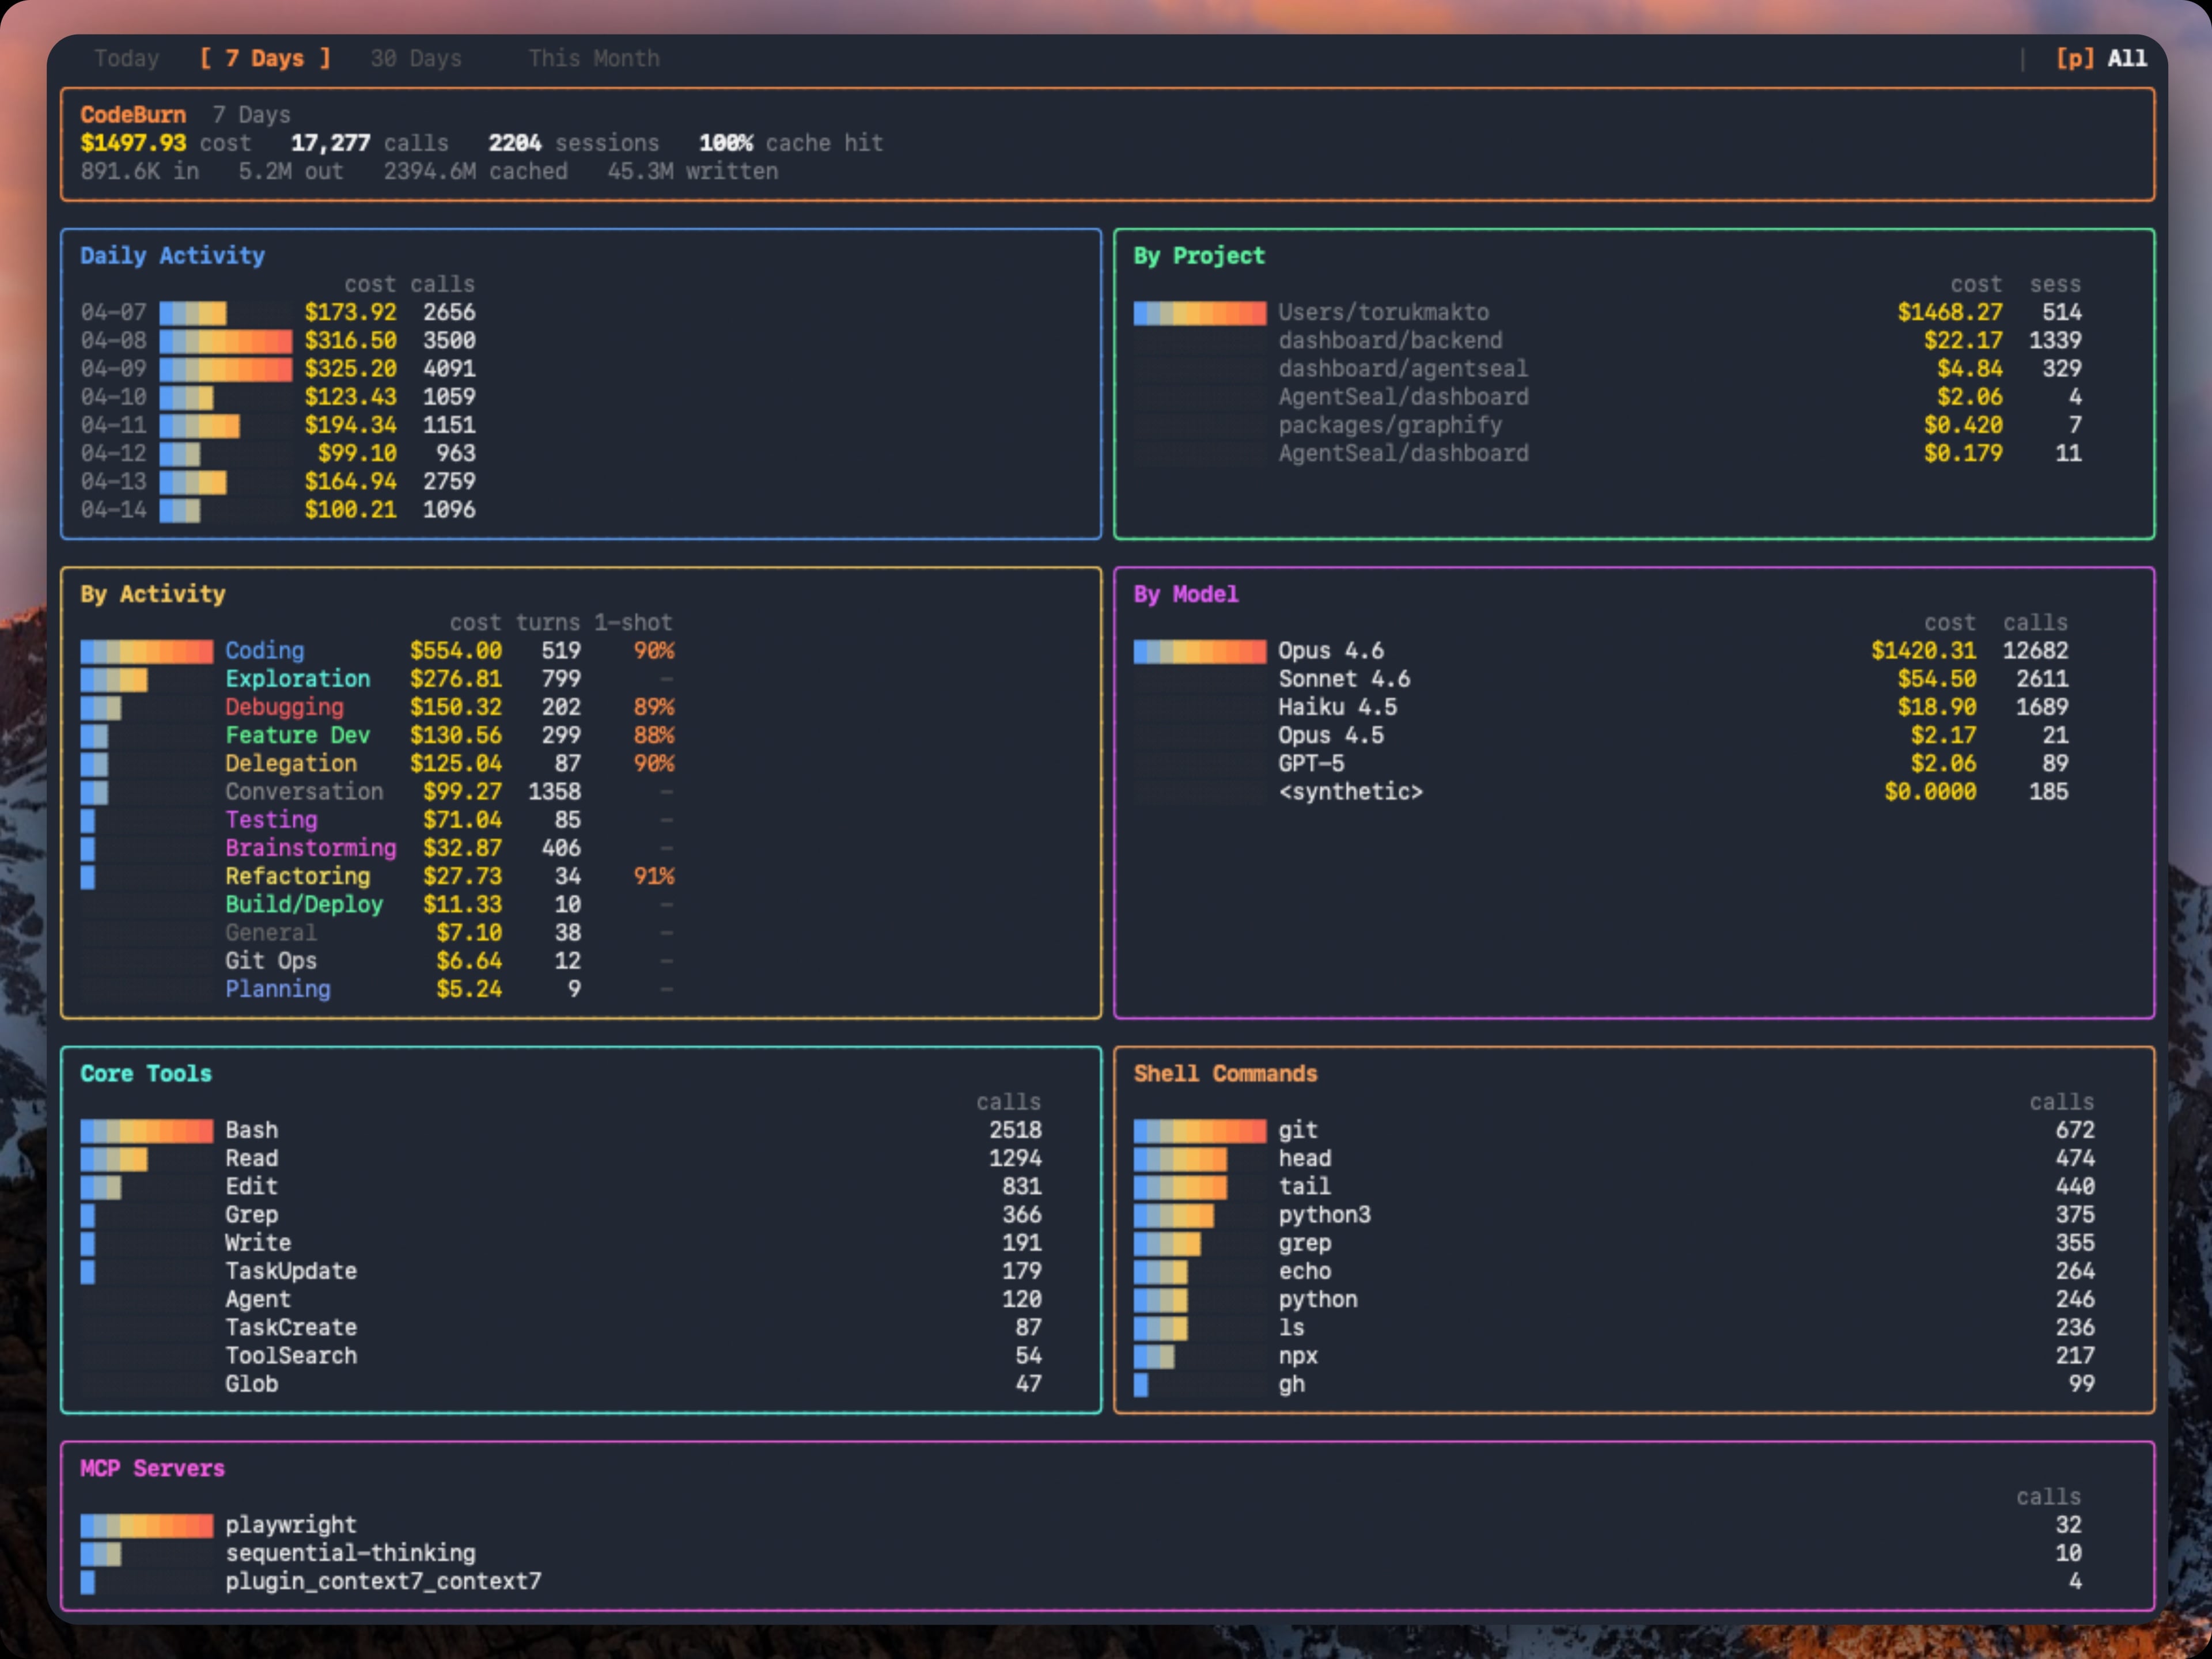
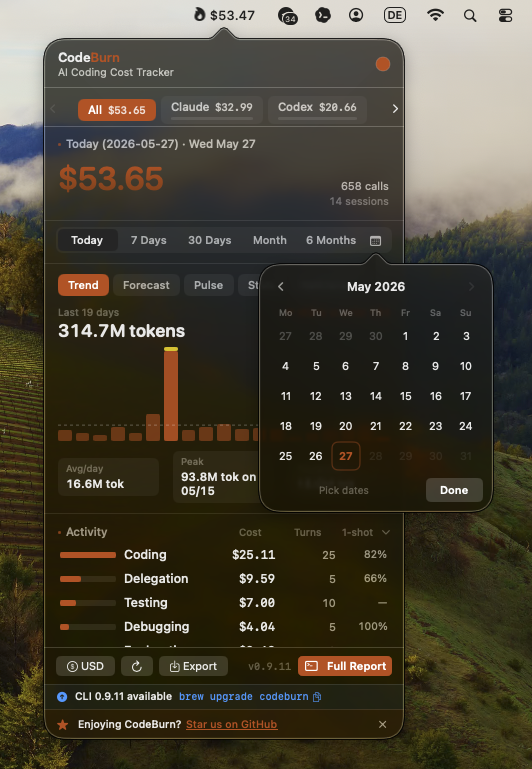
See the dashboard and interface in action CodeBurn provides a concise dashboard and a streamlined menu bar to keep you informed without interrupting your workflow. The TUI dashboard presents a snapshot of your recent usage, while the macOS menu bar provides a compact, always-on glance at the current spend period and quick access to insights. The visuals below give you an idea of the aesthetic and the kind of information you can expect to surface at a glance:
- CodeBurn TUI dashboard: a rich, interactive view of usage across periods
- CodeBurn macOS menubar: a lightweight, unobtrusive status indicator
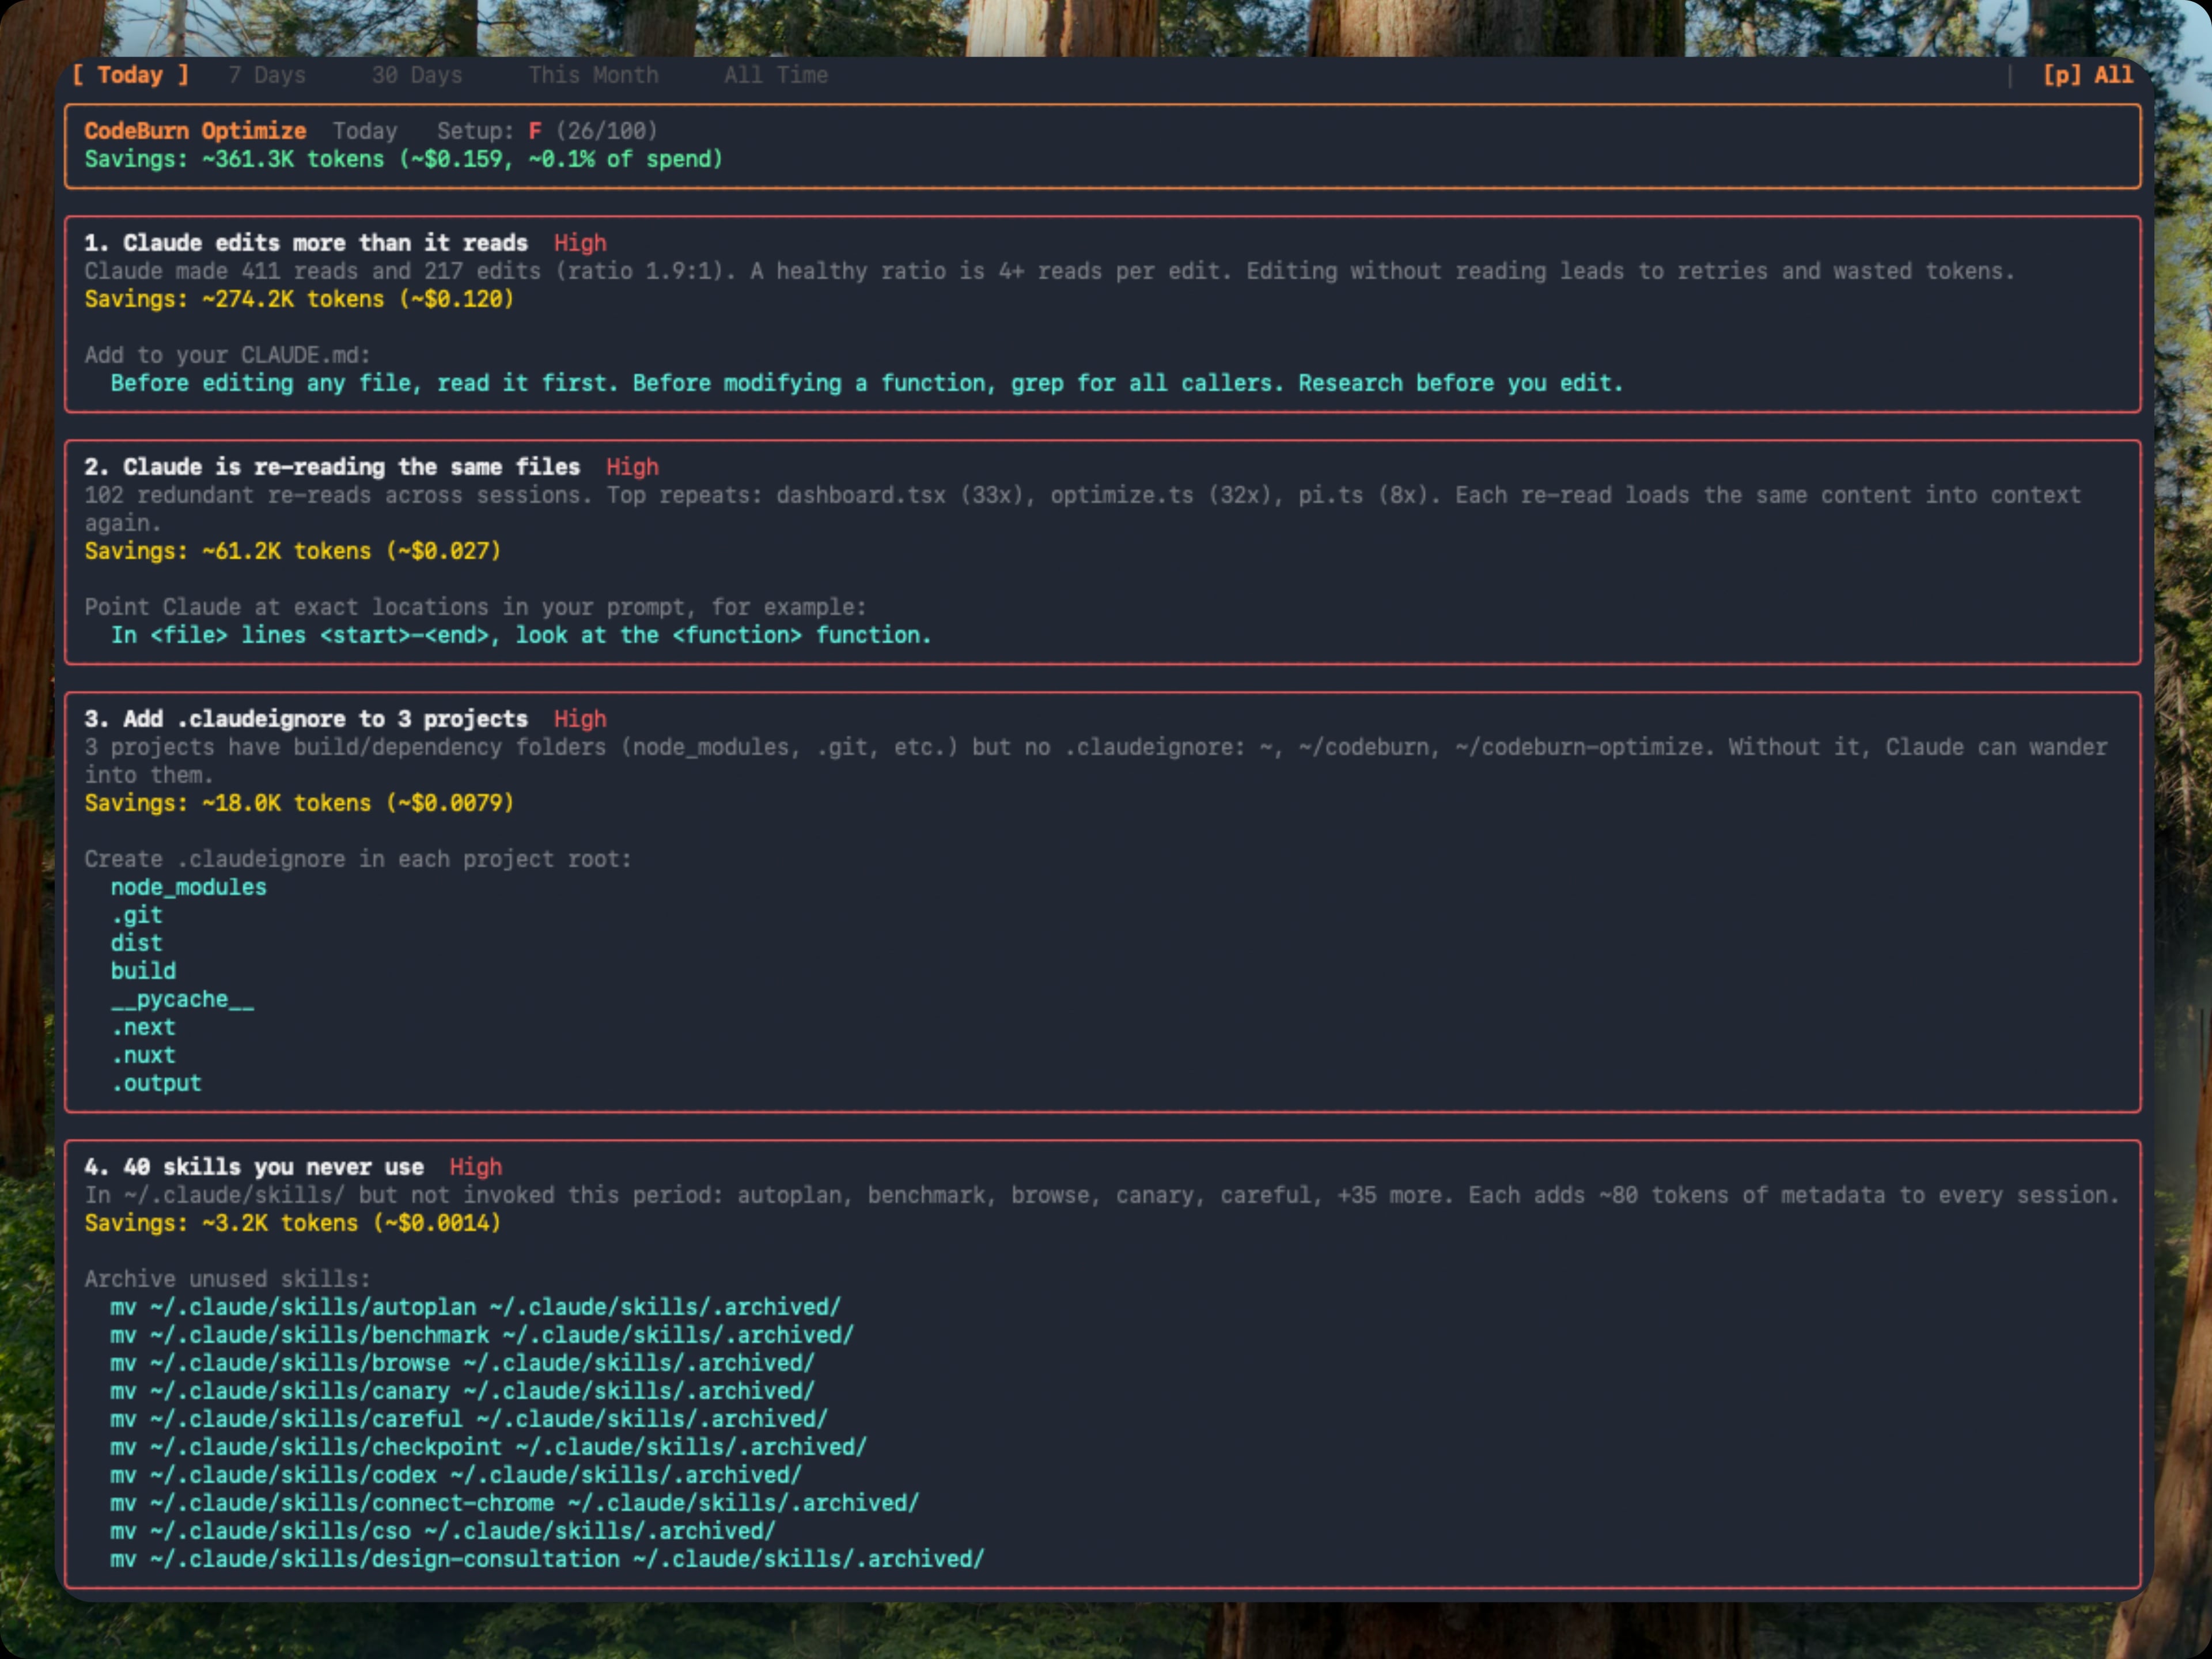
- CodeBurn optimize: a focused view into waste and opportunities
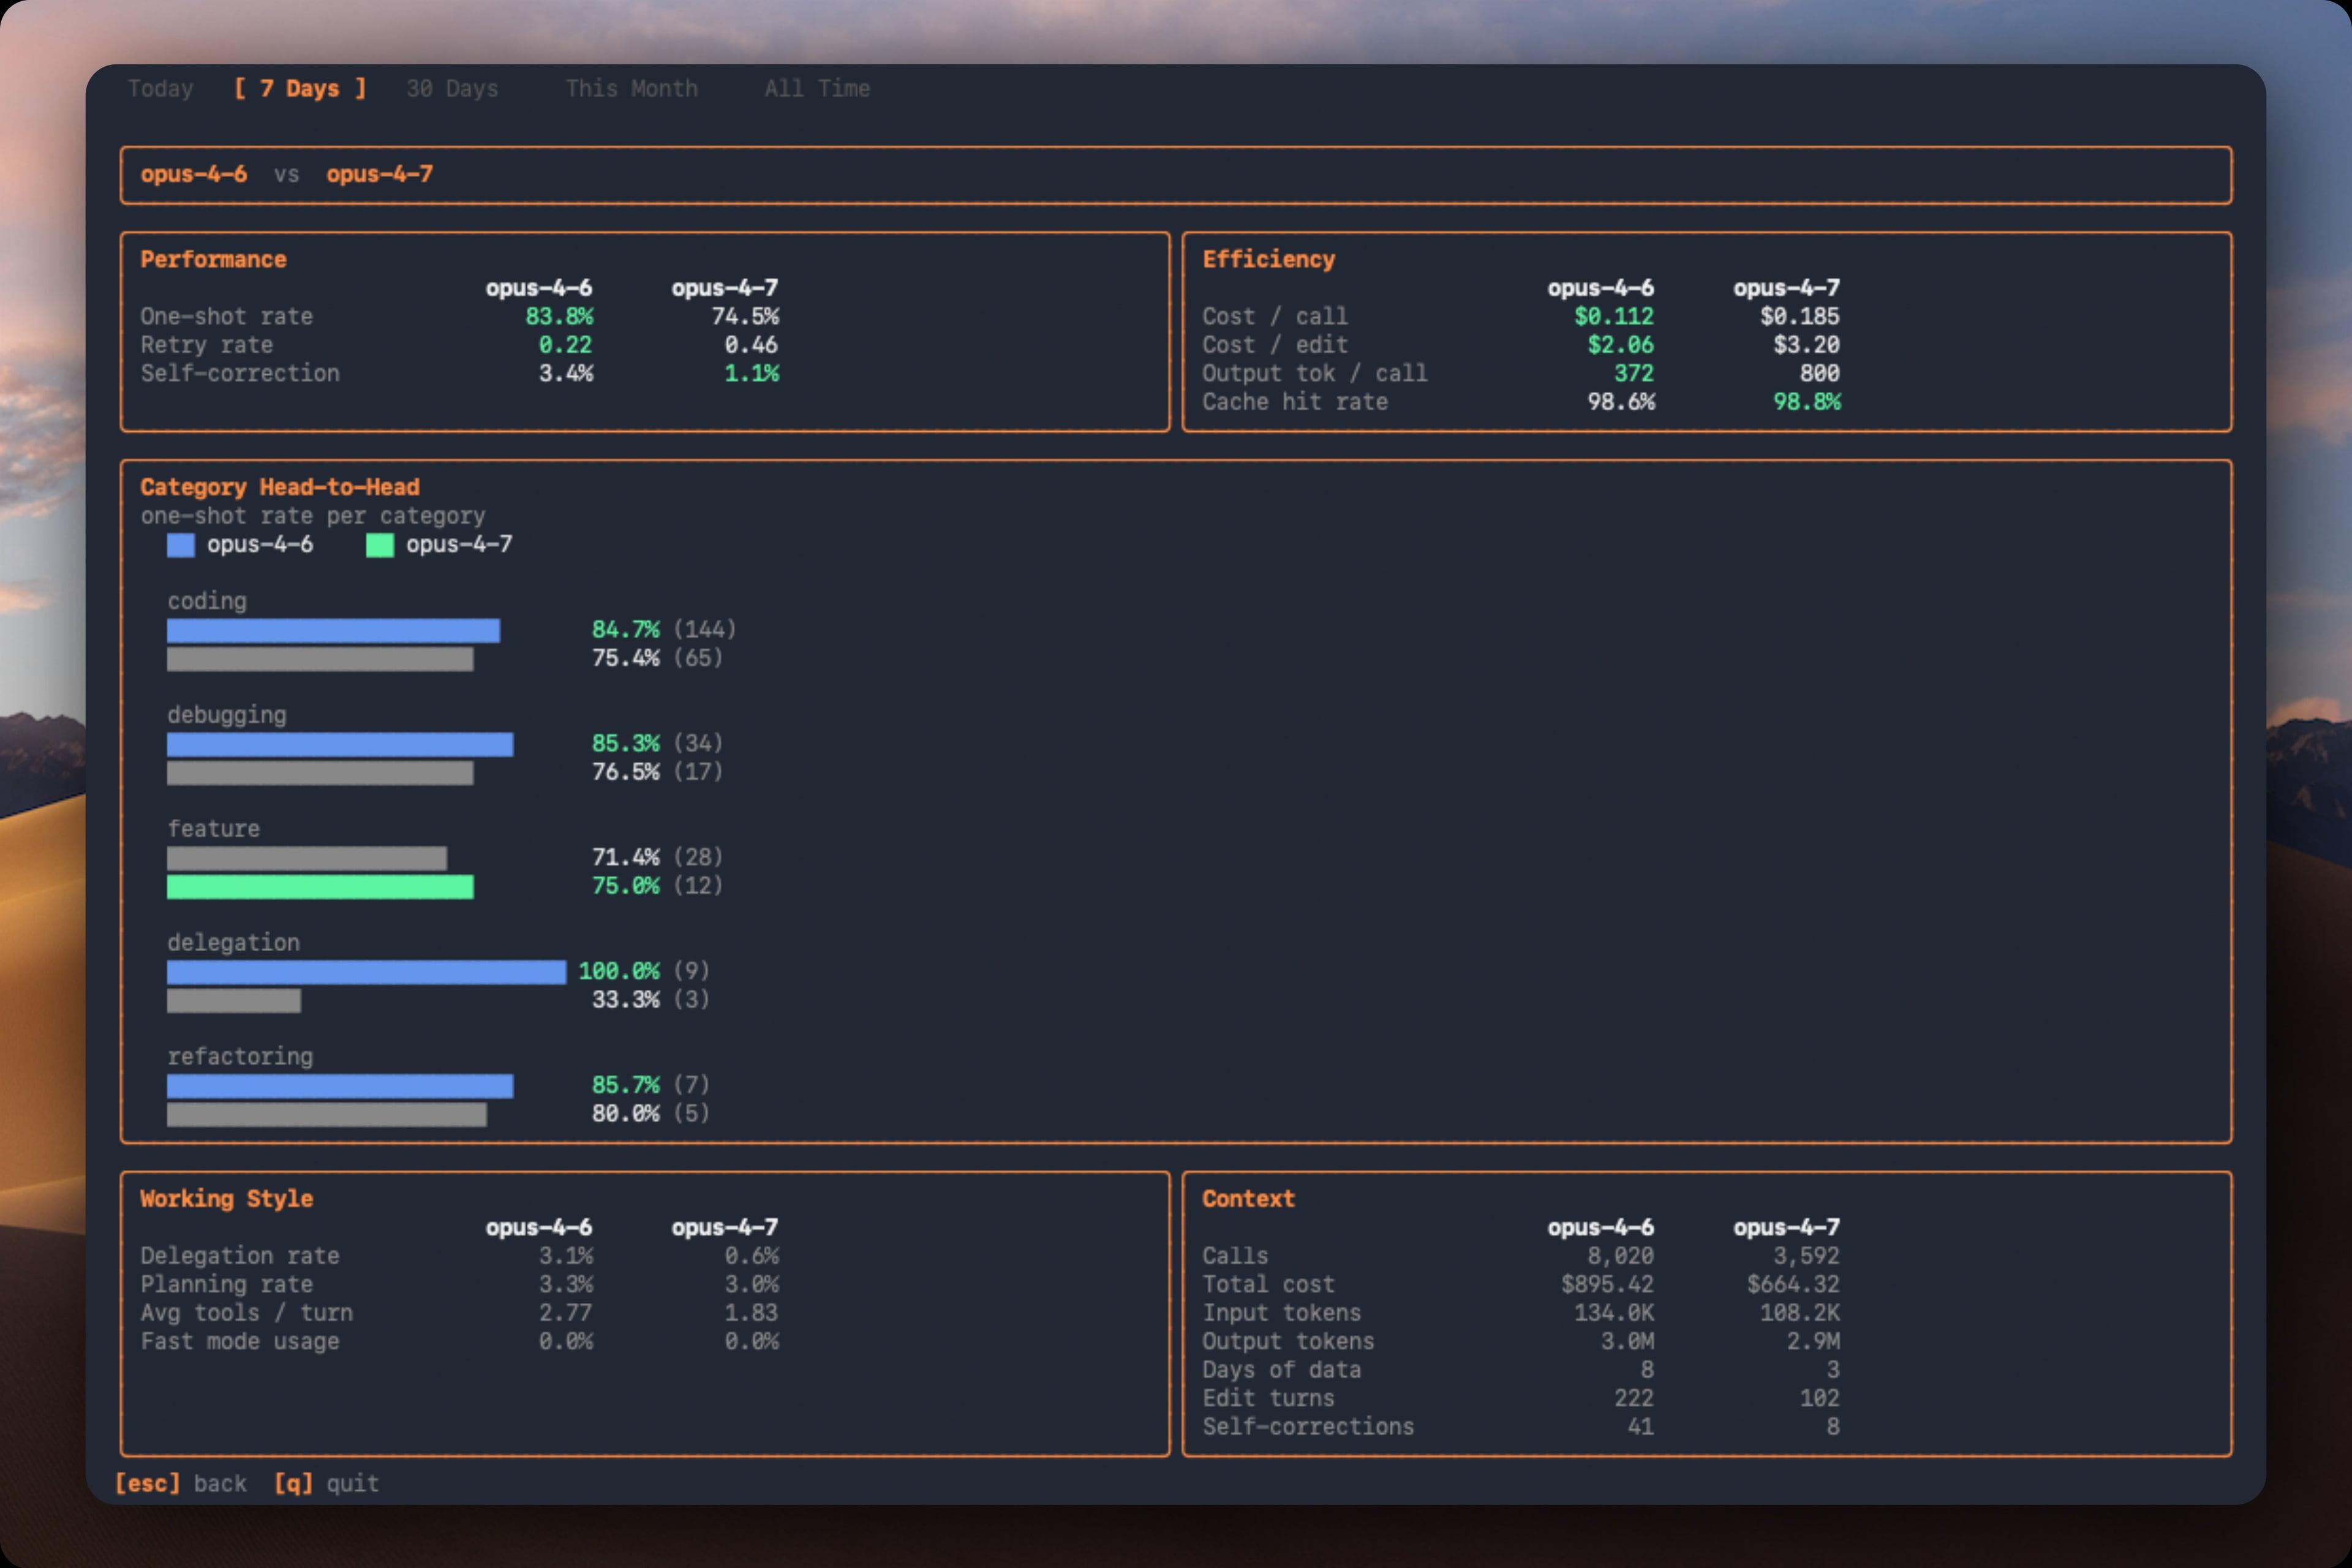
- CodeBurn compare: side-by-side model comparison for apples-to-apples insights
Requirements and installation CodeBurn is designed to be straightforward to install and ready to roll with the tools you already use. Here are the essentials:
- Node.js 20+) is required
- At least one supported AI coding tool with session data on disk
- For Cursor and OpenCode support, better-sqlite3 is installed automatically as an optional dependency
Install options
- npm installation (global):
- npm install -g codeburn
- Homebrew (macOS):
- brew install codeburn
- Run directly without installing:
- npx codeburn bunx codeburn dx codeburn
Usage at a glance CodeBurn’s command set is designed to cover interactive exploration, ad-hoc reports, and automated exports. Here are representative workflows you’ll likely use often:
- Interactive dashboard (default: 7 days)
- codeburn
- Today’s usage
- codeburn today
- This month’s usage
- codeburn month
- Rolling window report (e.g., last 30 days)
- codeburn report -p 30days
- Full history across all sessions
- codeburn report -p all
- Exact date range report
- codeburn report --from 2026-04-01 --to 2026-04-10
- JSON payload of the full dashboard
- codeburn report --format json
- Auto-refresh every 60 seconds (default 30)
- codeburn report --refresh 60
- Compact status line for quick checks
- codeburn status --format json
- Export data as CSV
- codeburn export
- Export data as JSON
- codeburn export -f json
- Optimize for waste (identify cost-saving fixes)
- codeburn optimize
- Compare models
- codeburn compare
- Yield: productive vs reverted/abandoned spend
- codeburn yield
Nudges, shortcuts, and navigation Arrow keys move you through the dashboard sections; you can press q to quit, or use 1 through 5 as quick shortcuts to switch between Today, 7 Days, 30 Days, Month, and 6 Months. Press c to open model comparison, or o to jump to the Optimize view. The dashboard auto-refreshes by default (you can disable with --refresh 0). Shortcuts and navigation are designed to help you stay focused on your code, not on data wrangling.
Supported providers and how CodeBurn handles data CodeBurn is built to work with a broad ecosystem of AI coding tools. The project includes a comprehensive provider map, each with its own data storage conventions and quirks. The idea is to read session data from local logs, then reassemble a coherent, per-project picture of usage and cost.
Representative providers and notes
- Claude Code and Claude Desktop
- Codex (OpenAI)
- Cursor and Cursor Agent
- GitHub Copilot
- Gemini CLI
- Mistral Vibe
- OpenCode
- OpenClaw
- Warp
- Forge
- Roo Code and KiloCode
- IBM Bob
- Kiro
- Pi and OMP (Oh My Pi)
- Antigravity
- Goose
- Qwen
- Kimi Code CLI
- And many more
Illustrative logos and provider identifiers appear in the documentation. A representative provider splash is included in the header image above, and individual provider docs point to the exact data locations, storage formats, and known quirks. For example:
- Claude Code and Claude Desktop
- Provider notes detail how data is stored and merged across multiple directories
- Mistral Vibe
- Data lives in ~/.vibe/logs/session/ with meta.json and messages.jsonl
- Kiro
- Conversations stored as .chat files, with token counts inferred
- GitHub Copilot
- Reads session-state and transcripts from standard VS Code storage
- OpenCode
- Uses SQLite databases and session tables for token usage
- Warp
- Uses warp.sqlite and exchange-level attribution logic
- Forge
- Conversations in Forge DB, with per-message usage accounting
- Claude proxies and multiple config directories
- CLAUDECONFIGDIRS allows merging across accounts or profiles
Provider-specific notes (high level)
- Cursor: Log data from a local SQLite database; initial run on large databases may take a minute, results are cached for speed
- Gemini CLI: Sessions are stored as JSON files with token counts included
- Antigravity: Provides a live hook to capture short CLI sessions; sanitization keeps only totals
- Mistral Vibe: Cumulative session data under ~/.vibe, with per-session totals
- OpenCode, OpenClaw, Warp, Forge, and others each have their own schema and location; CodeBurn normalizes this into a single, comparable view
What makes CodeBurn special: data locality and accuracy
- Local operation: all data reads and pricing happen on your machine; no wrapper, no proxy, no cross-network traffic
- Realistic pricing: LiteLLM powers pricing, with hardcoded fallbacks for edge cases to avoid mispricing
- Cache-aware: token counts include input, output, cache reads, cache writes, and occasional web search costs
- Per-turn and per-session insights: you’ll see how many edits happened per session, the one-shot rate, and where retries occurred
- Multi-provider, single-project view: sessions across providers can be merged by project, giving you a true total
Pricing, currency, and plans CodeBurn integrates pricing data from LiteLLM, cached locally for up to 24 hours. It tracks input, output, cache interactions, and web search costs. It also includes a fast mode multiplier for Claude, hardcoded fallbacks for certain models to prevent mispricing, and a currency system for universal reporting.
Currency and exchange
- Command examples show currency settings:
- codeburn currency GBP
- codeburn currency AUD
- codeburn currency JPY
- codeburn currency --reset
- ISO 4217 currency codes are supported for 162 currencies
- Exchange rates are fetched from Frankfurter (ECB data) and cached for 24 hours
- Configuration lives in ~/.config/codeburn/config.json
- The currency setting propagates to the dashboard, the status bar, menu bar, and all exports
Model aliases and filtering CodeBurn helps with messy naming in pricing data by supporting model aliases. This is helpful when providers alter names or use proxies:
- Add an alias: codeburn model-alias "my-proxy-model" "claude-opus-4-6"
- List aliases: codeburn model-alias --list
- Remove an alias: codeburn model-alias --remove "my-proxy-model"
Filtering by project, provider, or date range
- You can filter the data you see and export by:
- codeburn report --project myapp
- codeburn report --exclude myapp
- codeburn report --exclude myapp --exclude tests
- codeburn month --project api --project web
- codeburn export --provider cursor
- Date range controls: codeburn report --from and --to
- You can combine filters to fine-tune your view
JSON output for automation
- The JSON formats for report, today, and month provide the complete dashboard data
- Useful for post-processing with jq or exporting to dashboards
- Example: codeburn report --format json | jq '.projects'
The dashboard at a glance: what to look for
- Cost and usage trends: daily cost, number of sessions, and cache hit rate
- Per-project and per-model breakdowns: where the big spends come from
- One-shot rate and retry rate: indicators of model performance during edits
- Core tools, shell commands, and MCP servers: where heavy tool usage resides
- Fast mode usage: how often Claude’s fast path is engaged
How to read the data, per provider CodeBurn explains where each provider stores its data and how it reports usage. This is essential if you’re debugging or onboarding a new data source:
- Claude Code stores transcripts as JSONL in a per-project structure; CodeBurn reads those lines and computes token usage
- Codex uses per-call events with token counts and function_call data for tooling
- Cursor stores data in a SQLite database; CodeBurn caches results to avoid repeated disk reads
- OpenCode and Warp present data in SQLite or agent logs with per-exchange token attribution
- Mistral Vibe and others store messages and totals in a way that CodeBurn can aggregate across sessions
Dashboard usage patterns and interpretation CodeBurn’s dashboard is designed to tell a data story. Here are patterns you might notice and what they might imply:
- Cache hit rate below 80%: prompts or context may be unstable; consider reconfiguring caching or data freshness
- High Read counts per session: the agent is re-reading the same files; investigate whether it’s necessary or if context should be cached differently
- Low one-shot rate (Coding category): edits occur with retries; look for ways to simplify prompts or adjust tool selection
- Opus 4.6 dominating cost on small turns: a fast but expensive model for simple tasks; consider switching to a cheaper model for routine edits
- Heavy use of dispatch_agent or task tools: possible sub-agent proliferation; assess whether consolidation could reduce token usage
- No MCP usage shown: you may not be using MCP servers or config is misconfigured
Practical tips for teams
- Start with a clear plan: identify which providers you actually rely on, and consolidate sessions where possible
- Use the currency feature to view costs in your local currency or in USD for benchmarking
- Regularly run optimize to surface wasteful patterns and get ready-to-run fixes
- Use compare to understand how different models perform on similar tasks
- Use yield to correlate AI sessions with Git activity, helping you gauge real productivity against spend
Provider notes: a glimpse into complexity and nuance The provider notes section is dense because every tool has its own data model, logging strategy, and quirks. CodeBurn documents these nuances so you can understand how costs are attributed and how to adjust your workflows:
- Cursor: Auto mode may mask the exact model; pricing uses Sonnet estimates
- Gemini CLI: Sessions are JSON with embedded input tokens; CodeBurn accounts for cached vs. input tokens
- Antigravity: Live hook captures short CLI sessions for more precise usage
- Mistral Vibe: Cumulative totals per session; CodeBurn reads from meta.json and messages.jsonl
- Kiro, Roo Code, KiloCode: Conversation logs and token estimates from content length, with some normalization
- IBM Bob: Reads per-message usage and model selection from UI messages
- Claude with multiple config dirs: CLAUDECONFIGDIRS merges sessions across multiple directories into one per project
Environment and extensibility CodeBurn is designed with a pragmatic, extensible architecture:
- Supports a wide array of providers
- Handles multiple data directories via environment variables
- Aliases and filters help normalize and refine pricing
- Data locations and quirks are documented per provider, making it easier to add new providers in the future
Community, sponsorship, and getting involved CodeBurn is a community-friendly project, with sponsorship options and support channels:
- See the sponsor link to contribute
- Community discussions and issues are welcome to address provider quirks, schema drift, and feature requests
- The goal is to keep token-level cost accounting accurate and useful for teams of all sizes
A final note on usage, privacy, and philosophy CodeBurn emphasizes privacy and control. By design, all data reads and token pricing happen locally, on your machine, using locally cached pricing data. No external API keys are required for cost accounting, and your session data never leaves your computer unless you export it. The philosophy is simple: provide a transparent, auditable ledger of your AI-assisted coding activity, so you can optimize your tooling without compromising security or privacy.
Images and visuals recap
- Hero banner: CodeBurn at a glance with provider icons
- Header banner image: https://raw.githubusercontent.com/getagentseal/codeburn/main/assets/providers.png
- Dashboard visuals: the TUI dashboard, menubar, optimize, and compare
- TUI dashboard: https://raw.githubusercontent.com/getagentseal/codeburn/main/assets/dashboard.jpg
- macOS menubar: https://raw.githubusercontent.com/getagentseal/codeburn/main/assets/menubar-0.9.11.png
- Optimize view: https://raw.githubusercontent.com/getagentseal/codeburn/main/assets/optimize.jpg
- Compare view: https://raw.githubusercontent.com/getagentseal/codeburn/main/assets/compare.jpg
Conclusion: a practical tool for the pragmatic coder CodeBurn is built for teams and individuals who want a trustworthy, local-first ledger of AI-assisted coding activity. It tracks, prices, and explains usage across a broad spectrum of tools, providing actionable insights without compromising data sovereignty. With its flexible data sources, detailed provider notes, and a fast, intuitive dashboard, CodeBurn helps you answer the question: exactly where is your AI coding budget going, and how can you make it more efficient?
If you’re curious about token economics, model behavior, and cost-saving opportunities, give CodeBurn a try. Install, connect your sessions, and let the dashboard tell you the story of your AI-enabled development. From there, you can optimize your workflows, compare models, and plan your subscriptions with confidence. The result is not just cost visibility—it’s a path to smarter, more intentional AI-assisted coding.
Enjoying this project?
Discover more amazing open-source projects on TechLogHub. We curate the best developer tools and projects.
Repository:https://github.com/getagentseal/codeburn
GitHub - getagentseal/codeburn: CodeBurn
CodeBurn: A Local-First Dashboard for AI Coding Costs. It monitors token usage, cost, and performance across 25 AI coding tools, breaking down every dollar and ...
github - getagentseal/codeburn
